How food processors use FluroSense to evaluate potato planting density trials
The challenge
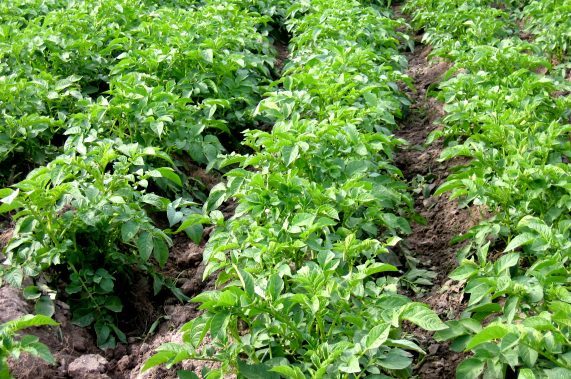
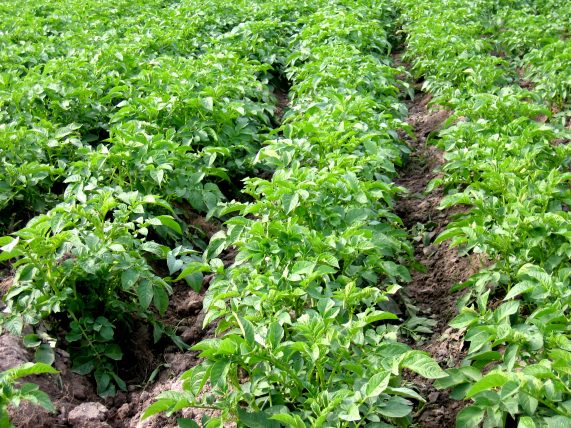
- Potato planting density/rate directly affects yields, but the optimal density varies for specific sites (soil and environmental conditions) and variety
- On-farm trials to find optimal density (especially for farms planting potato for the first time) can get extremely labour intensive and repetitive when it comes to analysing results manually
Solutions
- Quantifiable metrics such as crop performance are imperative to objectively assess optimal planting density
- FluroSat arranged for drone flight (fitted with Micasense MX Rededge multispectral camera) over the trials to collect biomass (NDVI) and canopy chlorophyll content (NDRE, CCCI)
- Drone imagery was then stitched and processed using Pix4D software
- Using FluroSense, the remote sensing data is easily divided into the trial plots and compared – even over different plantings
is the main goal of planting rate optimisation.
Data analysis
Separating the trials
In the FluroSense software, it is easy to use the drone orthomosaic to set up the boundaries of each plot, which can be used for all images in the future.
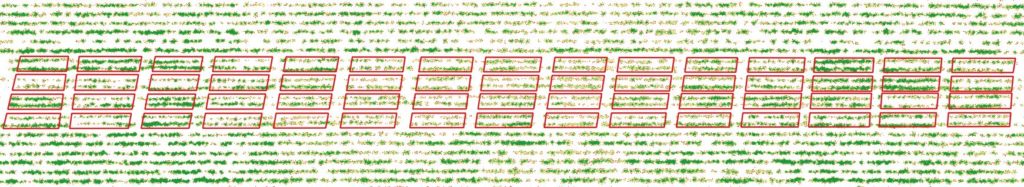
One of the benefits of drone data is its high resolution (2.5 cm/pixel), which allows to easily locate and analyse the trials individually. The trial “net” in FluroSense is used to automatically extract NDVI values of each trial.
Assessing NDVI
NDVI is normally associated with plant vigour, and values range from 0-1. High NDVI is correlated with healthy, green plants with high canopy biomass. The scale allows enough variability to differentiate between planting rates. NDVI is most effective for inferring information during mid-early growth stages of the plant development since it becomes saturated after canopy closure.
Watch our tutorial here on how to track crop growth with appropriate vegetation indices.
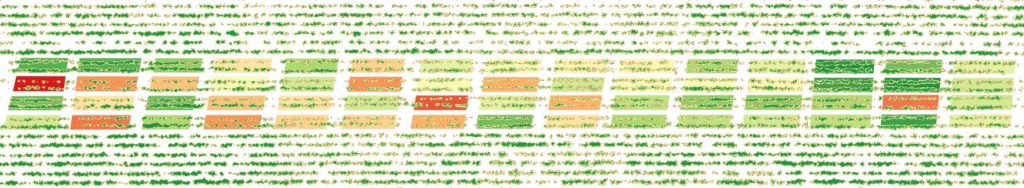
The image below shows the variability of the average NDVI across the trial plots. The greener, the higher the NDVI. The redder, the lower the NDVI.
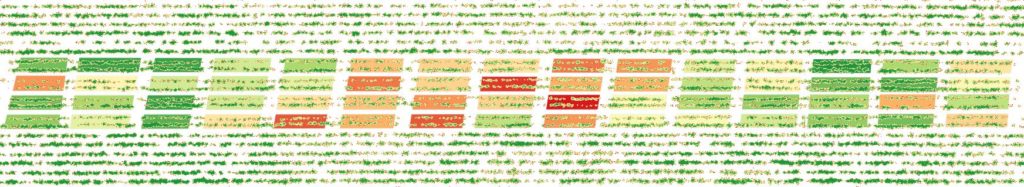
Assessing crop cover percentage
The same method of per plot metric extraction and colouring has been used on the crop cover percentage. Crop cover percentage can be calculated by taking a ratio:
pixels with vegetation / total area of the plot
Higher crop cover values mean that the canopy will be able to capture the solar radiation more efficiently than the areas with fewer plants.
Planting density outcomes
- The study has shown that crop cover percentage and NDVI were highly correlated. No big surprises here, but having a quantifiable result allows assessing the significance of the correlation as well as the variance.
- There’s a high correlation between the calculated indicators (crop cover percentage and NDVI) and the crop planting density. Increasing the number of plants per ha/acre is a straightforward way to optimise planting and increase plant growth and thus, yield
Flurosat takes data analysis to the next level. We can finally make half-measures that are highly dependent on the observer a thing of the past and have factual, comparable data from drone imagery. Data that is reliable, is consistent, is accurate. Data that can be worked down even to individual plants. Everybody knows that precise agriculture is the future and Flurosat makes some promising and solid developments towards that goal!
Dimitrios Syminelakis, Potato Food Processor
This short case study shows how using remote sensing data, the grower and his advisors were able to easily quantify the performance of the trial plots in an objective way and make objective decisions about what planting rate worked best in their fields.
Trial assessments are easily scaled in FluroSense to analyse hundreds of plots at a time, such as in the use cases presented to us by seed breeders, plant geneticists, and research agronomists looking to fast track their time-to-market and receive objective results on the performance of their trials.
Have a trial you needs to evaluate? Drop us a line to book FluroSense demo and get access to tools that make trial data analysis easy.
Recent Posts

FluroSat Acquires Dagan to Unlock Potential and Profitability of Resilient Agriculture
Regrow Is First Single Platform to Systemize, Scale and Monetize …Read More »
800+ Participant Webinar Proves the Ag World Is Ready to Embrace Regenerative Farming and Carbon Markets
By Adrian White | 2.15.2021 How do we get carbon …Read More »