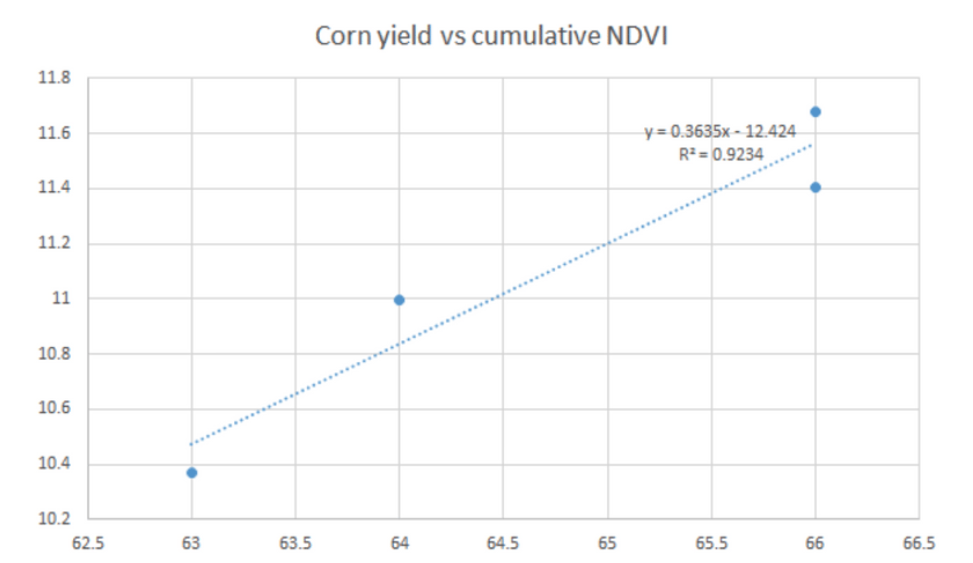
[Case Study] End of season analysis: crop stress implications and how to predict yield variability in advance with 92% accuracy

FluroSense Crop Stress and End of Season report can make a significant difference (up to 4.5 t/ha!) to your in-season management decisions and post-season analysis. Learn how you can use data to your advantage in fine-tuning your management and expectations of the yield before harvest!
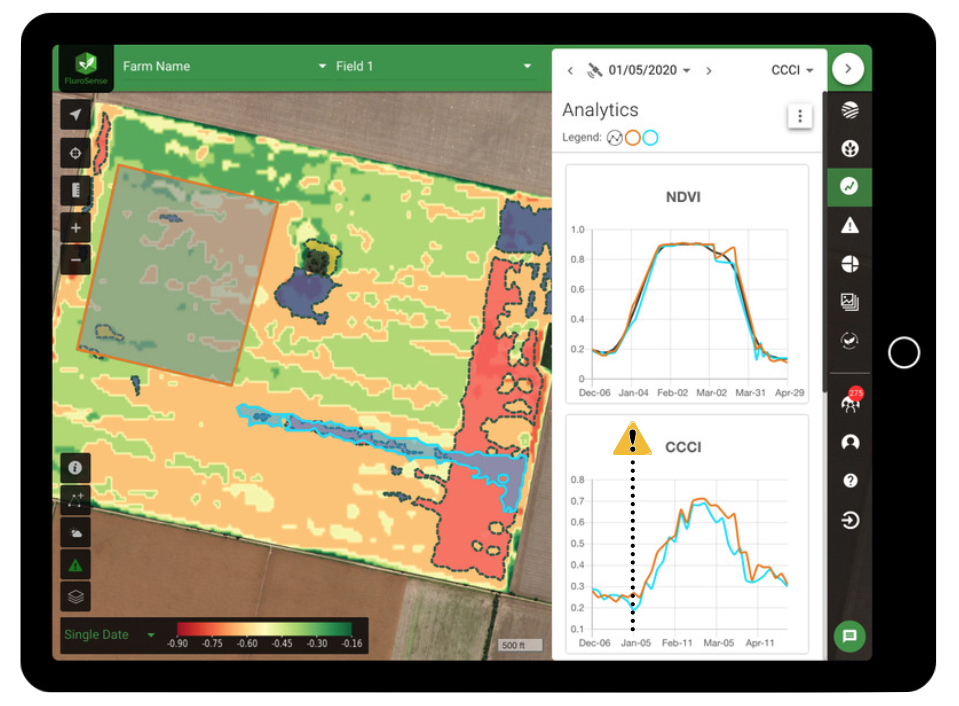
During the cropping season, especially early on, it is hard to notice important anomalies in crop growth due to them being invisible to the naked eye, yet it is critical to address them at that early stage.
Satellite imagery-based crop stress detection, such as provided by FluroSense, provides growers and their advisors not only with early detection but also location and quantification of the area subjected to crop stress. Moreover, the detection alert comes into your inbox early in the season when it was still possible to avoid the yield damange by replanting, or by looking into the application of products to support plant development.
In the attached case you will see how timely actions would have prevented a 21.7% yield loss in the area of the detected crop stress!
Later in the season, when you are preparing for harvest it is crucial to get a good estimate of the yield that you will be able to get from every field. This estimate gives you the power to market and accurately price your harvest, and maximise the profits from the season.
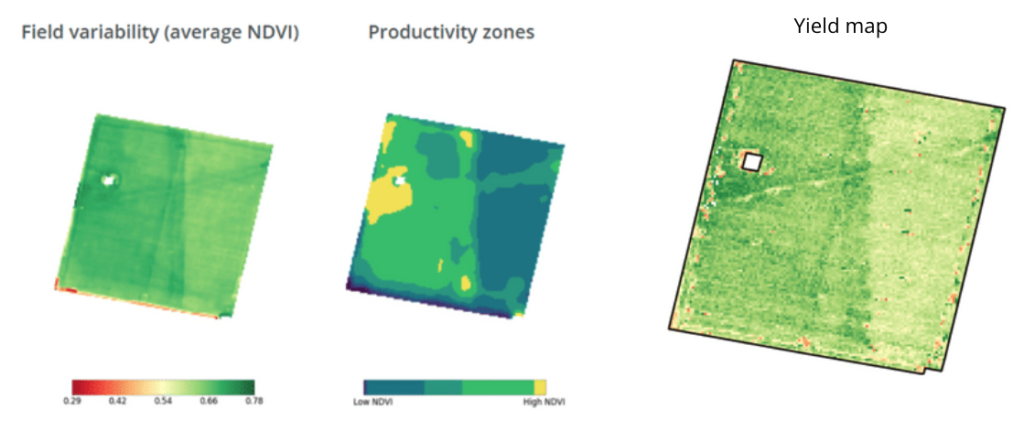
Yield prediction can be tricky, but FluroSense provides an easy tool to make it more transparent and help you calibrate your yield expectations. End of Season report is a report that can be run anytime after full canopy closure to demonstrate
- productivity zones in your fields, showing how your fields are likely to perform at harvest,
- benchmarks of the performance of every commodity across the farm,
- ranking the fields that will over-/under-perform, so you can take informed actions and marketing decisions.
After harvest, when you are sitting down to analyse how the season went and what management practises were worth your time and money, pull up the End of Season report to cross-reference it with your yield maps (easily done in FluroSense) and to validate the correlation.
You will be impressed how much more accurately you can predict yields by utilising site-specific crop monitoring data!
Access the case study
Read this report to learn how a corn and soybean farm Don Eugenio in Córdoba, Argentina was able to accurately and early quantity the damage from crop stress and get 92% accurate yield variability prediction!
To learn more about crop stress and End os season reports, reach out to us.
Recent Posts

FluroSat Acquires Dagan to Unlock Potential and Profitability of Resilient Agriculture
Regrow Is First Single Platform to Systemize, Scale and Monetize …Read More »
800+ Participant Webinar Proves the Ag World Is Ready to Embrace Regenerative Farming and Carbon Markets
By Adrian White | 2.15.2021 How do we get carbon …Read More »